|
The demonstration site for this project is a freshwater marsh with both submerged and emergent vegetation. The salinity of the creek ranges from freshwater to approximately 5 parts per thousand (ppt) depending on season and rainfall. Based upon previously conducted site investigations by the Army, PCBs, DDx, mercury and other metals were identified as the primary COPCs at the CCSA.
The creek is bordered by tidal marsh emergent vegetation with small areas of scrub-shrub and forested wetland, and receives some input from contaminated groundwater seeps. A more complete description of the site, COPCs, wetland vegetation, and the demonstration site may be found in the field demonstration plan (click here to view the Demonstration Plan).
Treatability Studies
To support the Field Demonstration, focused laboratory treatability testing was performed with site hydric soils and evaluated activated carbon and organoclay for sequestration, and zero-valent iron for reductive abiotic dechlorination of DDx. The Treatability Study included 1) evaluation of amendment effectiveness, 2) amendment dose optimization, and 3) a bioaccumulation study. The effectiveness of amendments were tested in laboratory batch experiments to evaluate if the reagents successfully sequestered or dechlorinated PCBs and/or DDx. Amendments were evaluated at different doses to understand the dose-response characteristics of each amendment. Effectiveness was measured based on a decrease in pore water contaminant concentration and laboratory bioaccumulation tests to demonstrate decrease in contaminant tissue residues using the freshwater oligochaete Lumbriculus variegatus, The results of the Treatability Study indicated that amendment with addition of 3% AC by weight was the most appropriate amendment choice for the demonstration (click here for the Treatability Study).
Permitting
For most projects conducted under CERCLA, the typical permits required for working in a wetland under the Clean Water Act and other relevant acts are waived or not required. For this project, the investigators and the regulatory authorities determined that state and federal permits were necessary to conduct the demonstration activities. USACE assumed the role of lead agency in cooperation with the MDOE. The following permits were issued or exempted:
Maryland State Programmatic General Permit, Category 3-- USACE Baltimore District, Water Quality Certification- MDE, Wetlands License- Maryland Board of Public Works Wetland Administration, and a Soil Erosion and Sediment Control Plan - Harford County Soil Conservation District (exempted). The USACE Baltimore District stated in the General Permit, “It is anticipated the material applied to the test plots will break down and be incorporated into the existing sediments. Therefore, the work is not expected to entail a permanent placement of fill material.”
As part of the program, and excellent Framework Guidance Manual was developed, which includes a discussion of relevant permits that may be required at similar sites.
Engineering Specifications and Contracting
Engineering design, specification and construction was done by AECOM with oversite by U.S. Navy NAVFEC. Specifications for the construction, health and safety, and monitoring are in the Field Demonstration Plan.
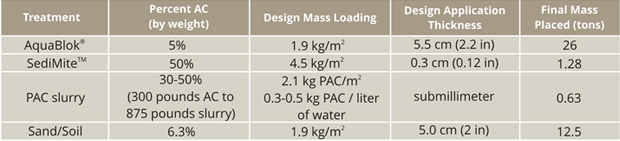
Given the target AC load of 3% from the Treatability Study, using measures made on the wetlands soil density and porosity, the design team determined that an addition of 1.9 kg/m2 of AC was needed to amend the top 15 cm (6 inches) of the wetland soils. For the three test AC treatments the following application rates were determined:
- AquaBlok® has a density of approximately 1,400 kilograms per cubic meter (kg/m3), with 5% by weight AC. The target for this product was to apply a minimum thickness of 5.5 cm over the test plots.
- SediMiteTM is 50% by weight AC, and was applied to a minimum thickness of 0.3 cm to dose a 10 cm layer of hydric soil with an application rate of 4.5 kg/m2. This included a 25% safety factor for loading.
- For PAC the design mass loading was 300 pounds AC to 875 pounds slurry per plot. Bench scale tests during the treatability study indicated that the PAC slurry could be prepared to contain 30 to 50% AC by weight. This corresponded to a ratio of 0.3 to 0.5 kg PAC / liter of water or about 2.1 kg PAC/m2.
In addition to the AC test plots, two types of controls were included: (1) control plots receiving no materials, and (2) Sand/soil control plots that received an application of a manufactured soil that was engineered by mixing a loam soil and organic matter. The cover system was designed to mimic native soil permeability and TOC content.
There were a total of twenty four 8 x 8 m test plots (click here to view figure)
AC Treatment Design Mass Loading and Thickness
Site Preparation
The following description of site preparation and application methods are summarized from the Final Project Report (click here).
Site preparation necessarily involved first ensuring the site was free of unexploded ordnance, delineation, set-up and clearing vegetation from the treatment plots, and ensuring a pathway to the treatment plots that would not harm the wetland areas, and baseline sampling. In order to ensure efficient placement while minimizing hard to the wetlands, site preparation and plot installation was done during the late Fall: November 29 – December 10.
Twenty test plots measuring 8 meters (m) by 8 meters (64 square meters) were staked out (click here to view test plot figure). An additional four, 8 by 8 m plots were established within the same area for SediMiteTM placement for project ER-0835. Temporary sediment control products (e.g., 15 cm diameter straw wattles) were placed around the perimeter of each plot, temporary plywood walkways were established between plots and at access points for amendment application activities. For each test plot vegetation along the perimeters was cut and the wattles were placed around the boundary of each plot area and secured using wooden stakes. The wattles were intended to ensure that placement amendments were isolated within their respective plots. Senesced vegetation inside the plots was manually trimmed to approximately one foot above grade to facilitate amendment placement.
Placement Methods
Material here is summarized from the detailed placement methods discussed in the Final Report (click here). Material placement activities occurred during the week of December 6, 2010.
AquaBlok®
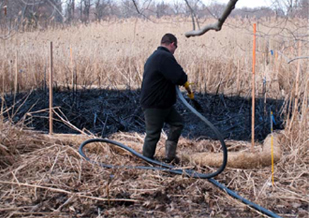
Twenty-six tons of AquaBlok® was deployed onto eight plots using a Finn Corporation model BB705 bark blower. AquaBlok® was delivered in 1.25 ton super-sacks on pallets and a forklift was used to lift the super-sacks above the receiving hopper of the bark-blower, where they were subsequently emptied. Each of the eight plots received approximately 3.3 tons of AquaBlok® (approximately 6,550 pounds); 2.5 super-sacks of AquaBlok® deployed with the bark-blower, with an additional 300 pounds of AquaBlok® deployed manually via five gallon buckets to achieve the design mass loading of AC (click here to view figure).
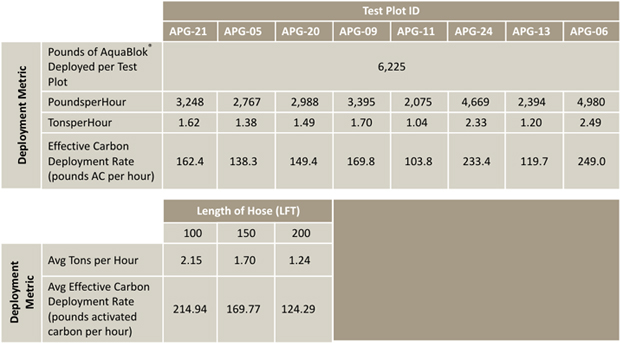
Deployment rates ranged between 1.24 to 2.15 tons per hour, which in part depended upon the hose length; longer hose lengths to the treatment plots resulted in slower deployment. In addition, the AquaBlok® would clog in the lines, requiring manual attention to dislodge the blockage. A series of videos shows the deployment via the back blower, placing the material onto the plot, and the manual clearing of the lines (click here to go to videos).
AquaBlok® Deployment Summary
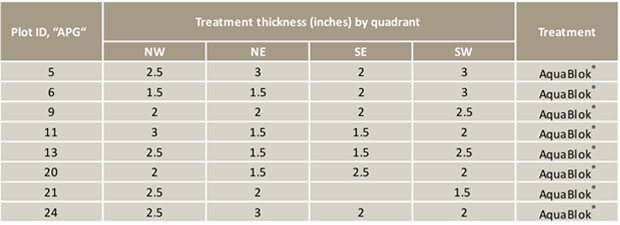
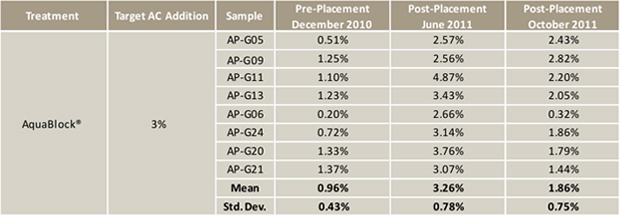
Target thickness for the deployment of the AquaBlok® agent was 5.5 cm (2 inches). Measures made in each of the plots showed that the target thickness was generally achieved.
The ability to achieve the target load of 3% black carbon was generally achieved, based on the 6 month post placement measurements. However, 10 months post-placement the target AC load had dropped approximately 1.4% and was below the targeted AC load. Whether this was a function of spatial heterogeneity, or loss of AC from the surface sediments, was not resolved in this study.
SediMite
SediMite™ was also broadcast but used a Vortex TR Aquatic System. Those placement methods are discussed separately in the case study for project ER-0835 (click here to go to the ER-0835 case study).
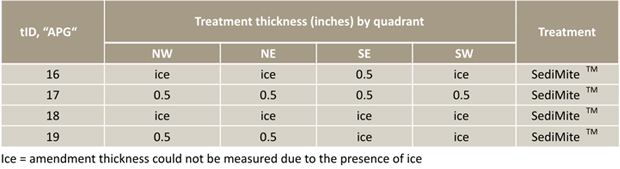
Target thickness for the deployment of the SediMite™ was 0.3 cm (0.12 inches). Measures made within the target plots showed that over-application of material occurred.
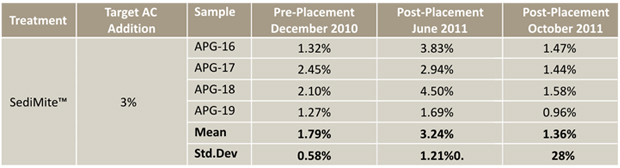
Based on the 6-month post-survey results, the target load of 3% black carbon was generally achieved. Like the AquaBlok® treatment plots, the 10 month post-placement the target AC load had dropped approximately nearly 2% and was below the targeted AC load. Whether this was a function of spatial heterogeneity, or loss of AC from the surface sediments, was not resolved in this study.
PAC Slurry Placement
Powdered activated carbon (PAC) was deployed onto four plots using a Finn Corporation model T75 hydro-seeder with a 750 gallon tank capacity. Six hundred pounds of PAC mixed with approximately 180 to 200 gallons of water (total weight of approximately 1,500 to 1,700 pounds). The PAC and water were loaded into the tank of the hydro-seeder to form a 35 40% slurry by mass. The hydro-seeder agitator was then used to mix the slurry, and approximately half of the mixture was pumped to each plot. The application process was conducted in approximately 15 minutes for each plot, during which time an even coating of the slurry was applied over the entire plot (click here to view figure).
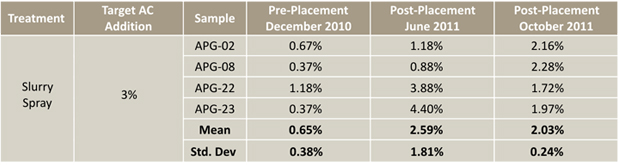
PAC placement onto the test plots was based on a mass/volume estimate; not on an acquired post-placement thickness. No thickness measures were made. Based on the 6 month post-placement the target addition of 3% was generally achieved, but with relatively high variability between the treatment plots. The 10-month post placement suggested that much of the previously measured AC remained within the plots.
Sand Mixture Placement
A sand mixture consisting of 90% sand and 10% organic rich topsoil was combined to create a manufactured soil cover amendment (“sand/soil control”) that was deployed on to four plots that served as control plots. Each of the plots received approximately 3.1 tons of the sand mixture. Sand was deployed successfully on APG-3 using the bark blower following the same application procedures as was used to place the AquaBlok®. However, the moisture content in the sand posed significant challenges. Due to the low air temperatures and high moisture content of the sand, the bark-blower clogged frequently and significantly. Approximately 2.15 tons was deployed to APG 10 using the bark blower before cold air temperatures rendered the bark blower inoperable. The remaining sand mixture (approximately 7.25 tons) was manually deployed via five gallon buckets.
Performance Monitoring
The results of the pre- and post-placement monitoring are summarized here, and may be found in detail in Section 5 of the Final Report.
AC Placement and Retention
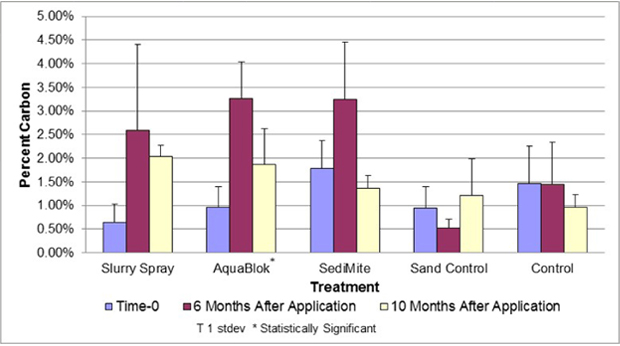
Within the treatment plots, AquaBlok® was observed to have the highest BC concentration at the 6 month sampling event (avg=3.26% (SD=0.78%)), followed closely by SediMite™ (avg. = 3.24% (1.21%)), and then AC slurry (avg. = 2.59% (SD = 1.81%)). At the 10 month sampling, the trend was reversed, AC slurry spray plots were observed to have the highest carbon content (avg. = 2.03% (SD = 0.25%)), followed by AquaBlok® (avg. = 1.86% (SD = 0.75%)) and then SediMite™ (avg. = 1.36% (SD = 0.27%)). Although the overall carbon concentration increased as a result of treatment application, the similar concentrations among treatments and between post-treatment monitoring events do not indicate a significant difference in treatment technology permanence or performance. PAC Slurry and AquaBlok® were the only treatments whose percent-black carbon concentrations between pre- and post-treatment were significantly different; SediMiteTM and the Sand Control were determined to not be significantly different.
Reductions in Bioavailability based on Porewater Sampling
Porewater PCB concentrations were determined from composite hydric soil samples collected from the treatment area. Porewater sampling was conducted with POM passive samplers. A confounding factor in the study was that the bulk sediment total PCB measures were highly variable by orders-of-magnitude. Porewater concentrations were also found to be highly variable. Concentrations prior to the application of reactive treatments ranged over 5 orders of magnitude (maximum 3.73x10-02 mg/L; minimum 5.69x10-07 mg/L) with an average concentration of 2.25x10-03 mg/L and a large standard deviation (7.07x10-03). The majority of samples were determined to be above the Maryland ambient water quality standard for Human Health and Consumption (>75%) and a large majority were above the Maryland fresh water chronic ambient water quality standard (>95%).
Following the application of the reactive amendment products, reductions in pore water concentrations were observed for most of the plots containing treatments (not controls) during at least one post treatment sampling event. PCB concentrations in pore water samples from treatment plots above the Aquatic Life Chronic WQS (at Time 0) were reduced to concentrations below this threshold after the reactive treatments were applied (Time 1 and/or Time 2) for some, but not all treatment plots. Porewater concentrations were generally not reduced to levels below the Maryland Human Health and Consumption WQS.
A general decrease in average total PCB pore water concentration was observed within the PAC Slurry and AquaBlok® treatment plots; however, the several orders of magnitude range of concentrations at Time 0 confounds the interpretation of treatment effectiveness based on pore water concentrations alone. Porewater PCB concentrations were relatively unchanged on average in the SediMite™ plots. However, differences in porewater PCB concentrations in the these measures compared to the results presented for ER-0835 may be due to differences in sampling intervals. For this study, a full 6-inch sample was collected and composited for analysis; for the ER-0835 study, only the upper 2-inches were composited and analyzed. Those results are discussed in the ER-0835 case study.

Reductions in Bioavailability based on Lumbriculous Bioassays
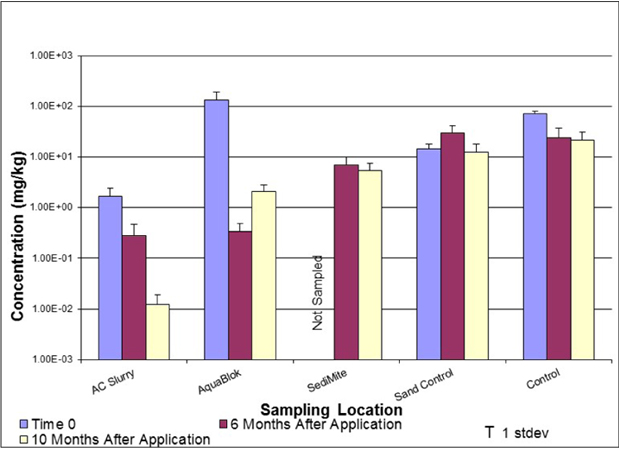
Bioaccumulation studies were conducted on composite hydric soil samples collected during the same three sampling events as the bulk hydric soil and pore water evaluations. Tissue concentrations from benthic organisms (L. variegatus) exposed to sediments within the testing area were found to be highly variable. Concentrations prior to the application of reactive treatments ranged over 4 orders of magnitude (maximum 3.57x10+02 mg/kg; minimum 4.33x10‐02 mg/kg) with an average concentration of 2.25 mg/kg and a large standard deviation (1.21x10+02). Following the application of the reactive amendment products, reductions in tissue concentration were observed for all of the treatments in which Time 0 data was available (AC Slurry and AquaBlok®). Time 0 concentrations for the SediMite™ treatment plots were not available. The AquaBlok® Lumbriculus receptor tissue concentrations were significantly different between pre- and post-treatment (but were lower, in this case). Slurry spray and Sand control Lumbriculus receptor tissue concentrations were weakly significant, and AquaBlok® and Slurry spray post-treatment Lumbriculus tissue concentrations were significantly lower than the control.
Ecological Assessments
No real effects on the aquatic marshland vegetation were found based on AC application at the site. While a goal of the study was to determine if the AC application had an effect on the macroinvertebrate community, the paucity of organisms during pre- and post-application prevented any meaningful assessment.
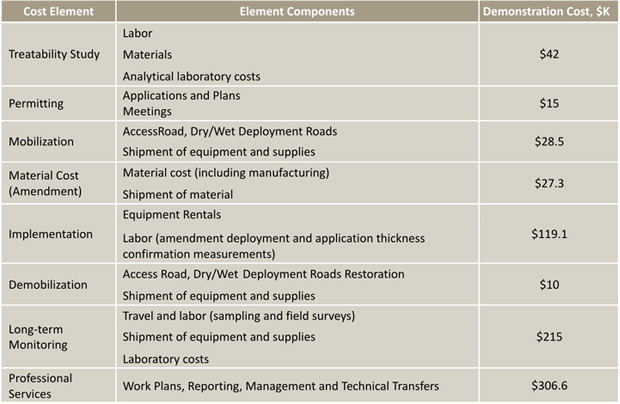
Costs
Costs for this project were tracked and presented in Section 7 of the Final Report.
|